Geo-TIDE gets a new look - and a new click feature!
- Danika MacDonell
- Dec 31, 2025
- 4 min read

Updated: Jan 8
Over the past year, we’ve been working behind the scenes to make Geo-TIDE (link to access instructions) easier to navigate and more intuitive to use. This post highlights two major updates: a comprehensive UI/UX refresh and a new interactive click feature that allows users to explore hourly and seasonal grid emissions profiles.
UI/UX Updates
To guide this redesign, we partnered with Viktoriia Tkachuk, a UI/UX developer based in Berlin, who conducted an initial assessment of Geo-TIDE against Nielson's 10 usability heuristics. Using Figma, Viktoriia developed a set of proposed improvements aimed at reducing visual clutter, improving consistency, and making key interactions more discoverable.
Implementation of these designs was carried out through MIT’s Undergraduate Research Opportunities Program (UROP). During the summer term, Amber Wu (Wellesley College) focused on restructuring the appearance of the public data box and legend. In the fall, Sophia Xin (Wellesley College) built on this foundation, refining the interface and implementing interactive elements such as highlight-on-hover behaviors and collapsible panels.
A harmonized visual style
Across the interface, we’ve introduced a more consistent visual language, including:
A single, consistent font throughout the tool
Standardized header and body text sizes
A unified color palette
Consistent button, dropdown, and icon styles
Together, these changes make the interface feel cleaner and reduce the cognitive load required to scan and interpret information.
Before

After


Fig. 1: Original (top) and updated (bottom) Geo-TIDE interface
Public and uploaded data boxes: Cleaner, faster interactions
The public and uploaded data panels are central to how users interact with Geo-TIDE, and they were a primary focus of this redesign. The updates aim to reduce visual clutter, surface functionality only when it’s needed, and make common workflows faster and more intuitive.
Improving readability and visual contrast
Several changes were made to ensure that data controls remain easy to read against the map background:
Opaque panel backgrounds improve contrast and legibility
Consistent spacing and typography make sections easier to scan
Icons in section headers, matched to legend symbols, provide quick visual cues


Fig. 2: Side-by-side comparison of the original (left) and updated (right) public data boxes
Reducing clutter through progressive disclosure
To keep the interface clean while preserving functionality, many controls now appear only when they are relevant:
Hover-based interactions, where checkboxes highlight and “More” buttons appear on hover
Chevron-based expand/collapse controls replace bulkier buttons
Collapsible sections allow users to hide panels they’re not actively using, freeing up screen space
These changes are particularly visible in the updated public (Fig. 2) and uploaded data boxes (Fig. 3), where secondary controls stay out of view until needed.


Fig. 3: Side-by-side comparison of the original (left) and updated (right) uploaded data boxes
Streamlining layer selection and management
We also simplified how layers are turned on, adjusted, and cleared:
Immediate layer activation on click, eliminating extra confirmation steps
Line breaks replace horizontal scrolling where possible, improving readability
A relocated “Clear all layers” button makes global actions easier to find
A confirmation dialog helps prevent accidental layer clearing
Users can now click outside pop-up windows to exit, aligning with common interface conventions
These changes streamline common workflows, especially when toggling between many layers or comparing datasets.
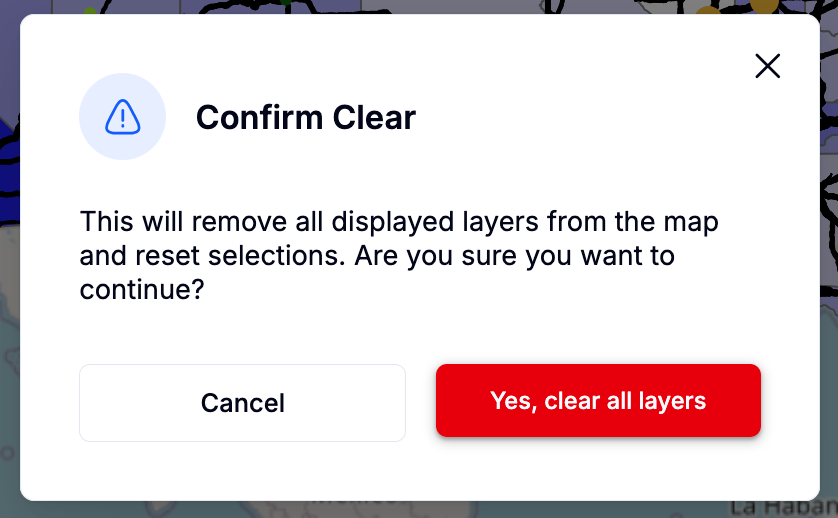
Fig. 4: Layer clearing confirmation window
Together, these updates make it easier to explore multiple datasets, compare scenarios, and maintain focus on the map itself.
Legend updates: Subtle cues, clearer context
The legend has also been refined to better support exploration:
Horizontal scrolling has been removed and replaced with line breaks
Legend entries are clearly organized based on the feature categories (area, highway, and point features) in the public data box
Newly added legend entries are temporarily highlighted, helping users quickly identify what changed when a new layer is turned on
This small interaction cue makes it much easier to connect on-map changes with their corresponding legend entries.


Fig. 5: Side-by-side comparison of the original (left) and updated (right) legend
Video 1: Temporary highlight of new legend entries
New click feature: Exploring hourly and seasonal grid emissions
Building on her earlier work to add an interactive click feature for incentives and regulations, Brooke Bao (Dartmouth College) collaborated with the MIT Climate & Sustainability Consortium to extend this functionality to grid emissions data.
Users can now click directly on regions of the U.S. power grid to generate plots showing:
Average hourly emissions intensity profiles over a 24-hour day
Seasonal and annual variability in emissions intensity
These visualizations are based on historical data from ElectricityMaps and allow users to quickly compare regions, identify cleaner charging windows, and better understand how grid emissions vary across space and time.
This feature is designed to support more informed decisions about charging strategies, infrastructure siting, and operational planning for electrified fleets.
Video 2 demonstrates the click feature for hourly and annual emissions profiles.
Video 2: Demo of the click feature for hourly and annual emissions profiles
What’s next
Looking ahead, we’re excited about several upcoming enhancements:
In the next phase of UI/UX work, we plan to add functionality that allows users to save snapshots of their sessions and return to them later, supporting continuity in analysis. We also aim to enable easy image capture and sharing, making it simpler to communicate insights with collaborators.
Brooke Bao is also developing new functionality within the incentives and regulations layer, including weekly web scraping to keep policies up to date and an LLM-powered chatbot to help users quickly identify incentives and regulations most relevant to their use case.
As always, we welcome feedback and ideas from users as Geo-TIDE continues to evolve.

Comments